Table of Contents
- Project Overview
- Features
- Use Cases
- System Architecture
- Key Functionalities
- Screenshots/Visuals
- Collaborators
- Future Enhancements
Project Overview
Understanding complex data structures is a significant challenge in computer science education. To address this, we developed the Interactive Data Structure Visualizer, a web-based platform that simplifies learning through real-time, Python-centric visualizations.
This innovative tool bridges the gap between theoretical concepts and practical understanding by offering dynamic visual aids, step-by-step execution tracing, and secure, containerized code execution. It’s designed for students, educators, and self-learners, fostering intuitive and hands-on exploration of data structures.
Features
- Real-Time Visualization
Observe live transformations in data structures during code execution. - Interactive Debugging
Step through operations like insertion, deletion, and searching to track variable changes. - Browser-Based and Platform-Independent
Accessible on any device without installations. - Secure Code Execution
Sandboxed environments ensure security for multi-user functionality. - Educational Enhancements
Includes intuitive error handling and conceptual explanations for each data structure.
Use Cases
- For Students
Visualize operations on data structures to grasp concepts effectively. - For Educators
Demonstrate real-time transformations in classroom environments. - For Developers
Debug and analyze code behavior intuitively.
System Architecture
The application follows a modular architecture:
- Frontend: Interactive UI with visualization components.
- Code Preprocessor: Manages code parsing and preparation for execution.
- Code Executor: Handles code execution requests and returns results after safe execution within isolated environments.
- Visualization Engine: Renders real-time visualizations based on execution data.
Key Functionalities
- Code Input and Execution
Submit Python code snippets and observe their execution. - Visualization
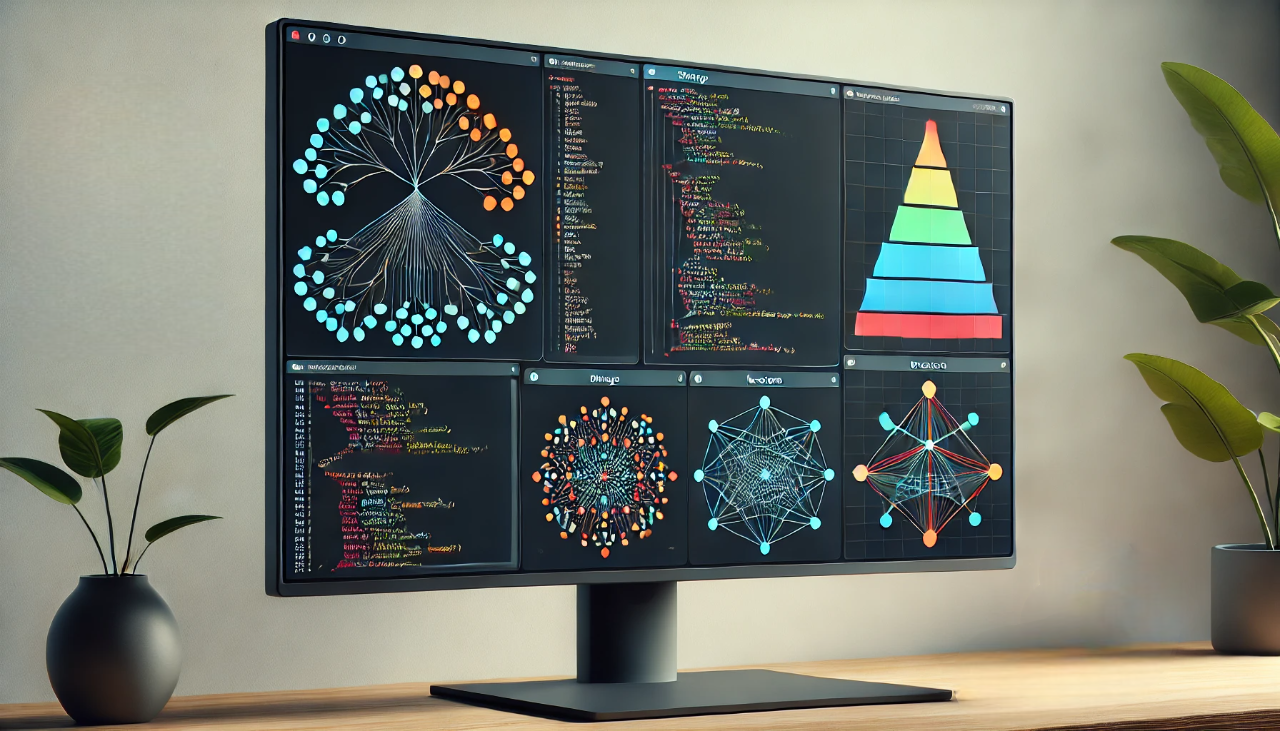
Displays step-by-step transformations in data structures like arrays, trees, and graphs. - Error Handling
Detects and highlights errors with detailed feedback. - Integration
Easily embeddable in Learning Management Systems (LMS) or educational platforms.
Screenshots/Visuals
(Coming Soon)
Collaborators
- Jayanth R
- Mekha L
- Srilakshmi R
- Vignesh S Naik
Future Enhancements
- Support for additional programming languages like Java and C++.
- Integration with AI-driven feedback to suggest optimizations.
- Advanced visualizations for algorithms like dynamic programming and graph traversals.
Links: Front-End repo Deployment


